Keep every GPU in service and every tenant informed
AI infrastructure is now a revenue line. When a GPU degrades, a fabric port flaps, or a storage tier slows, the cost shows up as missed SLAs and idle capacity. Rafay Observability gives neoclouds and enterprises one view of the full stack, from GPUs to firewalls, with AI that investigates incidents and workflows that fix them.
Deploys in your data center. The AI copilot is optional and runs against a model endpoint you provide.

Trusted by leading enterprises, neoclouds and service providers


.png)







What is Rafay Observability?
Rafay Observability provides monitoring, triage, and remediation for GPU data centers and AI clouds. It brings signals from GPUs, servers, network fabric, storage, firewalls, Kubernetes, and applications into a single multi-tenant view.
Atlas AI, the built-in copilot, answers plain-English questions about your infrastructure and runs automated root-cause analysis when incidents fire. Workflows, micro-agents, and cookbooks turn alerts into repeatable, auditable remediation.
Components: Telescope, Atlas AI, Synthetic Monitoring, Status Pages, Incident Management, and AI Flows.
Built for: neoclouds, sovereign AI clouds, and enterprises running private AI infrastructure.
Deployment: in your data center, with data stored in an S3-compatible object store you control.
Integrations: Slack, Microsoft Teams, email, Jira, PagerDuty, and Grafana.
Access control: RBAC, SSO, secrets management, and audit logs for every action.
Why observability matters for AI infrastructure
A GPU cluster depends on more moving parts than traditional compute: accelerators, InfiniBand fabrics, high-throughput storage, and the software stacked on top. A fault in any layer shows up as a slow job or an idle GPU, and general-purpose monitoring tools rarely connect the symptom to the cause.
For neoclouds and sovereign AI clouds
Your tenants buy on availability, and your margins depend on keeping capacity sellable.
Per-tenant views show GPU utilization, power draw, network traffic, and assigned resources for each customer. Status pages publish service health to customers or internal teams. GPU health and XID events arrive with a plain-language interpretation and a recommended action. Automated triage and remediation reduce the round-the-clock staffing that multi-region operations usually require.
For enterprises running private AI
GPU capacity is a capital investment, and degraded nodes quietly erode its return.
One view across compute, network, storage, and Kubernetes replaces a patchwork of vendor dashboards. Prebuilt alert packs give platform teams useful coverage from day one. Observability data stays in your data center, and AI features run only if you opt in. Role-based access and audit logs keep operations governed.
From signal to fix in one product
Rafay Observability connects collection, detection, investigation, and remediation, so an alert can move to a verified fix without switching tools.

1. Observe
Ingest metrics (OTLP and Prometheus), events, XID faults, health scores, fabric state, and BMC telemetry into one store.
2. Detect
Enable GPU, storage, and network alert packs in one click, run synthetic probes, and draft new alert rules in natural language.

3. Investigate
Atlas AI correlates logs, metrics, and topology across every layer and returns ranked root-cause hypotheses backed by technical evidence.

4. Act
Workflows run versioned cookbooks, call micro-agents, notify your teams, and pause for human approval wherever you require it.
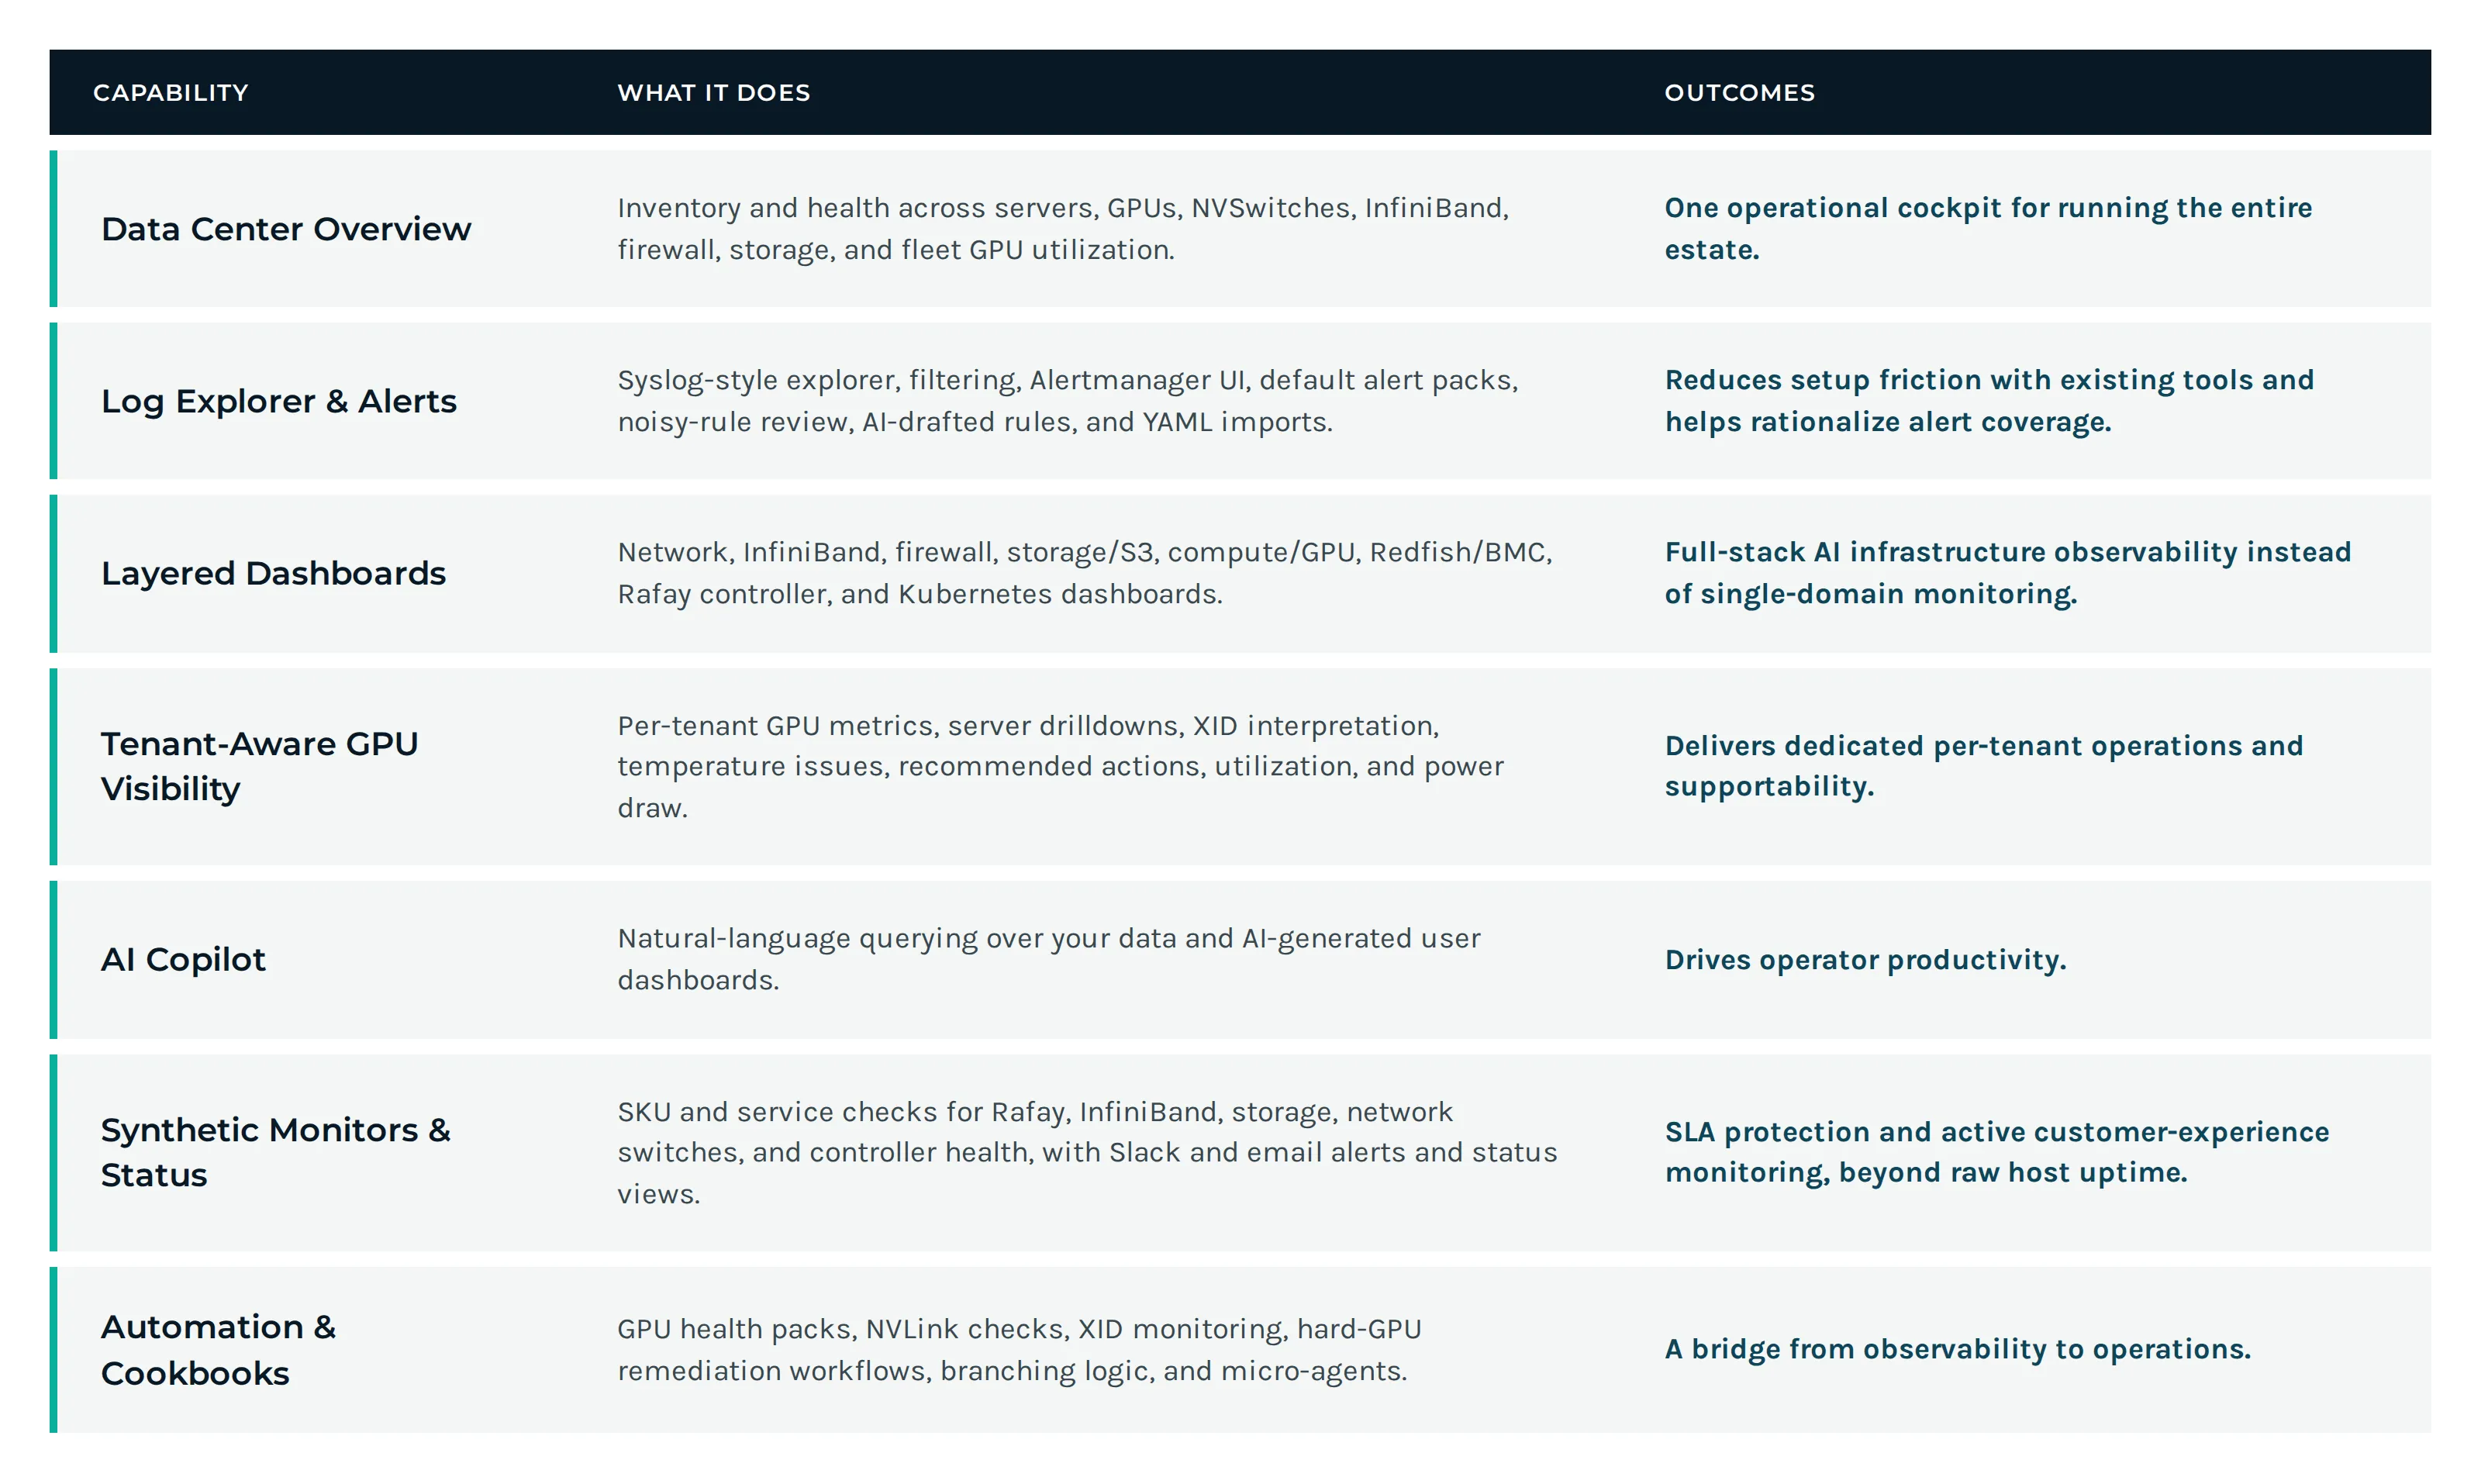
Rafay Observability Capabilities
Platform capabilities mapped to the operational outcomes they deliver.
Inside Rafay Observability
Six capability areas, delivered as one product with shared data, access control, and integrations.
Telescope: data center observability
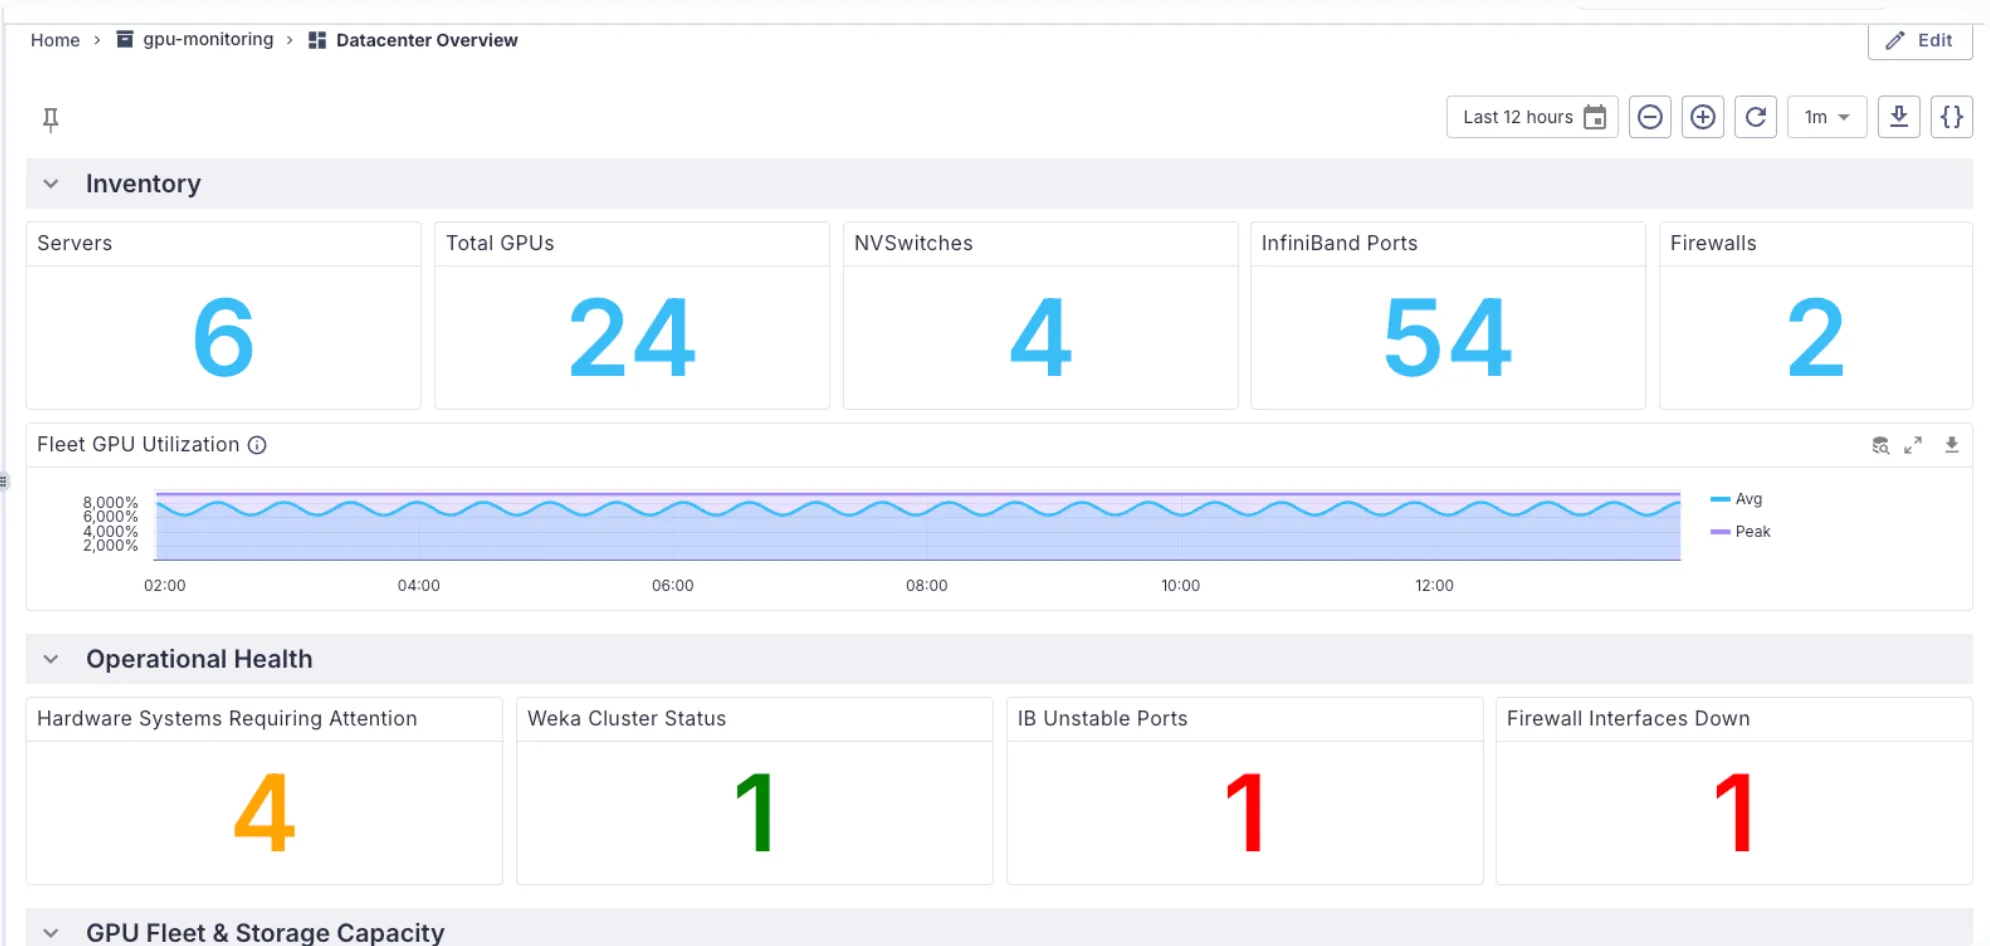
One view of clusters, hosts, GPUs, switches, storage, and firewalls. Includes a fleet inventory and health overview, customizable dashboards for InfiniBand, network fabric, firewall, storage, compute, and Redfish, a log explorer for syslog data, and tenant-level metrics.
Atlas AI: copilot and automated triage
Ask questions in plain English, such as "show GPU utilization over the last hour," and generate dashboards from your own data. When an incident fires, Atlas AI investigates on its own and attaches its findings with the relevant logs, metrics, and traces.
Synthetic monitoring and status pages
Scheduled Python and shell probes measure availability and latency from multiple regions. Results feed service health dashboards and status pages you can keep internal or share with customers. SLA breaches raise alerts and can trigger workflows.
Alerting and incident management
A front end to Alertmanager with one-click alert packs, noisy-rule review, YAML rule import, and AI-drafted rules. Smart alerts deduplicate and summarize signals from Rafay and third-party systems, and an agent can declare incidents based on severity.
Workflows, micro-agents, and cookbooks
Build deterministic workflows, or add micro-agents for AI-driven steps. Cookbooks codify fixes as versioned scripts that run on remote hosts through the Rafay observability agent. Prebuilt packs cover GPU health, NVLink and fabric checks, and XID error monitoring.
Guardrails and governance
Agents run with cost caps, tool-call limits, PII and prompt-injection detection, and optional DLP endpoint integration. RBAC, SSO, secrets management, and audit logs cover every action, and APIs expose every function, including dashboard export.
Built on the telemetry AI data centers already produce
Telescope ingests metrics (OTLP and Prometheus), events and XID faults, health scores, fabric and network state, and BMC hardware telemetry. Data lands in GreptimeDB, Prometheus, or VictoriaMetrics, with Alertmanager for alert routing. Notifications and tickets flow to Slack, Microsoft Teams, email, Jira, PagerDuty, and Grafana.
GPUs and accelerators
NVIDIA DCGM for GPU metrics and health. NVSentinel for fault and event detection. Fleet Intelligence for AI-driven fleet health scoring.
Network fabric and security
UFM and InfiniBand for fabric and port telemetry. NetQ for network state and validation. Firewall policy, drops, and ACL hits.
Servers, storage, and platforms
Redfish and BMC for server health and power draw. Storage IOPS, latency, and capacity. DSX Exchange as a cross-platform telemetry bus, plus Kubernetes clusters, VMs, and applications.
Service health your customers can see
Synthetic monitors track each service and its dependencies continuously. Uptime, downtime, and monitoring history roll up into dashboards for operators and status pages for the people who depend on the service.
Runs where your infrastructure lives
Rafay Observability deploys in your data center, next to the infrastructure it monitors.
The Atlas AI copilot is an opt-in feature that connects to a model endpoint you provide.
Observability data is stored in an S3-compatible object store you choose, and Rafay automates the backups.
Rafay keeps adding monitors, cookbooks, and workflows to the catalog, and your team can add its own or generate them with AI.
Rafay Observability FAQs
Rafay Observability provides monitoring, AI triage, and remediation for GPU data centers and AI clouds, deployed in your data center with one multi-tenant view of the full stack.
Rafay Observability provides monitoring, AI triage, and remediation for GPU data centers and AI clouds. It combines Telescope for full-stack visibility, Atlas AI for natural-language queries and root-cause analysis, synthetic monitoring, status pages, incident management, and automated workflows.
It is built around AI infrastructure signals such as GPU health, XID errors, InfiniBand fabric state, and BMC telemetry. It also includes multi-tenant views, automated root-cause analysis, and remediation workflows in the same product, so teams do not stitch those together from separate tools.
Yes. Dashboards can be filtered by organization, and tenant-level views show GPU utilization, power draw, network traffic, and the resources assigned to each tenant, alongside a global view of the full infrastructure.
In your data center. Rafay Observability deploys on your infrastructure and stores its data in an S3-compatible object store you provide. The AI copilot is optional and uses a model endpoint you specify.
Atlas AI investigates and recommends. Actions run through workflows you define, and any workflow can require human approval before a step executes. Agent guardrails cap cost and limit tool calls.
Yes. Import existing alert rules as YAML, add your own automation scripts as cookbooks, or describe what you need in natural language and let AI draft the rule or script for review.
Slack, Microsoft Teams, email, Jira, PagerDuty, and Grafana for notifications and ticketing, plus Prometheus, VictoriaMetrics, GreptimeDB, and Alertmanager on the data side. Every function is also available through APIs.
See Rafay Observability on your stack
Walk through Telescope, Atlas AI, and automated remediation with a Rafay specialist, using the GPU, network, and storage systems you run today.