When you're running LLM inference at scale, "the model works" is table stakes. What separates a demo from a production service is knowing how well your models perform under real-world conditions — how fast users see the first token, whether streaming feels natural, and whether your infrastructure is meeting the service-level objectives you've committed to. That's exactly where inference metrics come in.
Rafay's Token Factory transforms raw GPU infrastructure into governed, consumable AI services. It enables organizations to deploy models from sources like Hugging Face or NVIDIA NGC as production-grade APIs in minutes, with built-in multi-tenancy, token-metered billing, and auto-scaling. But shipping a model as an API is only half the story.
The other half is observability: knowing, in real time, whether your inference endpoints are performing within acceptable bounds. The Token Factory's built-in metrics dashboard gives operators exactly this visibility — surfacing the key latency, throughput, and resource utilization metrics that matter most.
This blog post breaks down the metrics available in the Rafay Token Factory, explains what each one tells you (and what it doesn't), and walks through a real example so you can interpret your own dashboards with confidence.
The Metrics That Matter for LLM Inference
Before diving into the Rafay dashboard, it helps to understand the core metrics categories for any LLM inference system. These fall into four groups: latency metrics, throughput metrics, percentile metrics, and resource utilization metrics. Each answers a different question about your system's health.
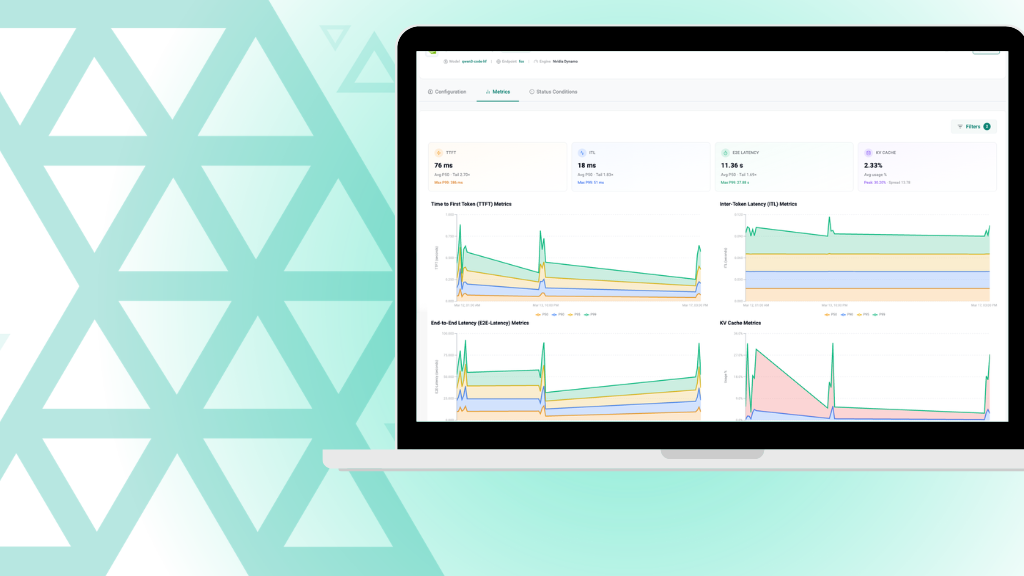
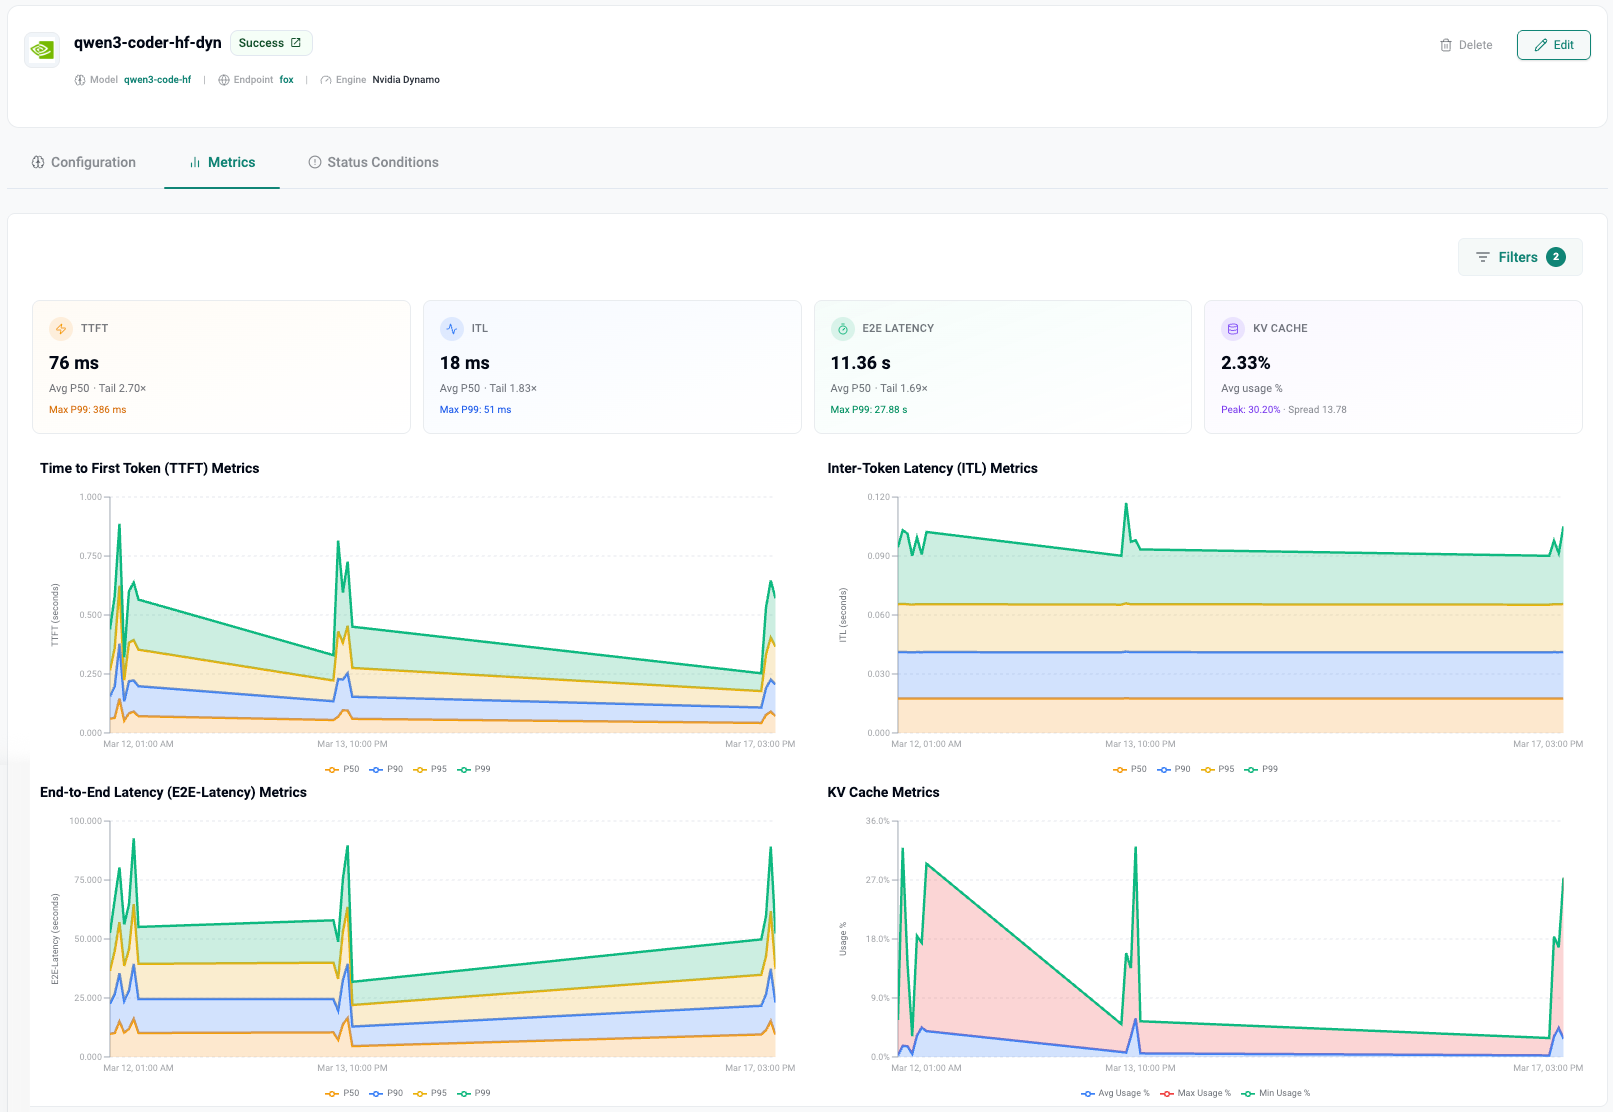
The image above is a real life metrics dashboard in the Rafay Token Factory. We will use this as an example for this blog.
1. Latency Metrics: What Users Actually Feel
Latency is the metric class that directly impacts user experience. There are three complementary latency metrics, each answering a different question about the request lifecycle.
TTFT — Time to First Token
TTFT measures the elapsed time between when a request is submitted and when the very first token of the response arrives. It captures three things: queue wait time, the model's prefill computation (where the entire input prompt is processed to populate the KV cache), and network overhead.
Why it matters: TTFT is what users feel first. In a chatbot, coding assistant, or any interactive application, a long TTFT creates a perception of lag before anything starts appearing on screen. For interactive workloads, the general industry target is a p95 TTFT under 500ms. Anything above that, and users start wondering if the system is broken.
What drives it up: longer input prompts (more prefill work), high queue depth under load, or insufficient GPU capacity for the model size.
ITL — Inter-Token Latency (also called TBT or TPOT)
ITL measures the time between consecutive generated tokens during the decode phase. While TTFT tells you how long before the response starts, ITL tells you how smooth the response feels as it streams.
Human reading speed is roughly 4–5 tokens per second, which means an ITL up to about 200ms is acceptable. Above 250ms, streaming starts to feel choppy or broken. For coding assistants where users read faster, you want even lower values.
Note : Crucially, ITL is a property of the decode phase only — it excludes the first token. As output length grows, the KV cache expands, and attention computation cost increases linearly with the total sequence length so far. This means ITL can degrade over very long outputs.
2. How Rafay Surfaces These Metrics
In the Rafay Token Factory, each model deployment gets its own dedicated Metrics tab within the deployment detail view. The dashboard is designed to give operators both an at-a-glance summary and deep time-series visibility.
The Summary Cards
At the top of the metrics dashboard, four summary cards provide a quick health check:
TTFT — Shows the average (p50) value and a "Tail" ratio indicating how much worse the slowest requests are compared to the median. For example, a TTFT of 76 ms with a Tail of 2.70× means the average request gets its first token in 76ms, but the slowest requests take about 2.7 times longer. The Max P99 is also displayed (e.g., 386 ms) to show the worst-case scenario.
ITL — Displays the average inter-token latency with its own tail ratio. A value like 18 ms with a Tail of 1.83× indicates very smooth streaming with minimal variance. A Max P99 of 51 ms confirms the decode phase is well-behaved even under pressure.
E2E Latency — Shows total request completion time. A value like 11.36 s is typical for longer responses (remember: this includes all output token generation). The tail ratio here (e.g., 1.69×) tells you how consistent the end-to-end experience is. Max P99 of 27.88 s reveals what the unluckiest users encounter.
KV Cache — Displays average GPU memory used for KV cache as a percentage. This is a resource metric unique to LLM inference — more on this below.
The Time-Series Charts
Below the summary cards, the dashboard presents four detailed time-series charts, each plotting values across p50, p90, p95, and p99 percentiles over time:
Time to First Token (TTFT) Metrics — Watch for spikes in the p99 line (shown in green in the dashboard). If the p50 stays flat but the p99 spikes, you're likely hitting queue contention during traffic bursts. Consistent elevation across all percentiles suggests the model or hardware is undersized for the workload.
Inter-Token Latency (ITL) Metrics — This chart should ideally show tight banding between percentiles. Wide gaps between p50 and p99 indicate inconsistent decode performance, possibly due to KV cache pressure, memory bandwidth saturation, or interference from concurrent requests. A healthy ITL chart looks like a narrow, flat band.
End-to-End Latency (E2E) Metrics — This chart reflects both TTFT and ITL behavior combined. It's the most variable chart because output lengths differ across requests. Look for the overall trend rather than individual spikes.
KV Cache Metrics — Tracks average, max, and min KV cache usage over time. This is your early warning system for memory pressure. If KV cache usage consistently climbs toward its peak or shows high variance, you may need to increase GPU memory allocation, reduce max sequence length, or add more replicas.
3. Percentile Metrics: Why Averages Will Mislead You
One of the most important things the Rafay dashboard does is display metrics at multiple percentile levels rather than just averages. Understanding why this matters is critical for operating production inference services.
p50 (Median)
The median represents the typical user experience — 50% of requests are faster, 50% are slower. It's great for dashboards and getting a general sense of performance. But it's terrible for SLAs. If your p50 TTFT is 76ms, that sounds great — until you realize the other half of your users might be waiting much longer.
p95
This is where 95% of requests fall below. The p95 captures what your "unlucky" 5% of users experience — and in production, that 5% adds up to a lot of real people. Most production SLA agreements are written against p95 values. If you're only tracking p50, you're blind to the experience of a significant portion of your users.
p99
The p99 reveals near-worst-case performance. It catches tail latency spikes that can indicate systemic issues: GC pauses, KV cache evictions, request queuing, or cold starts. If your p99 is healthy and consistent, you can be confident your system is stable. This is the metric to monitor if you want to actually sleep at night.
The rule of thumb: p50 is for dashboards. p95 is for SLAs. p99 is for sleeping at night.
4. KV Cache: The Metric Most Teams Miss
The KV cache metric is less well-known than latency metrics, but it's arguably the most important resource-level indicator for LLM inference. The KV cache stores the key-value pairs computed during the attention mechanism — it's what allows the model to "remember" the context of the conversation during token generation.
Here's why it matters:
Memory bound: The KV cache grows with both input length and output length. For models with long context windows, KV cache memory can exceed the memory required for the model weights themselves.
Throughput ceiling: When KV cache usage approaches capacity, the system can no longer accept new concurrent requests. This directly limits your throughput (requests per second) and can cause request queuing, which inflates TTFT.
Eviction and preemption: When KV cache memory is exhausted, inference engines like vLLM must either evict cached entries (losing prefix caching benefits) or preempt running requests. Both degrade performance.
In the Rafay dashboard, the KV Cache chart shows average usage %, peak usage %, and the spread between them. A deployment showing 2.33% average with a 30.20% peak tells you the system has plenty of headroom most of the time but experiences periodic spikes — likely correlated with bursts of concurrent long-context requests.
Watch for:
Sustained high average: You're running close to capacity. Consider adding replicas or reducing max sequence length.
Large spread between average and peak: Bursty workloads. Ensure your auto-scaling policies can respond fast enough.
Monotonically rising average: Possible memory leak or growing session lengths. Investigate request patterns.
5. Optimizing by Workload Type
Not all inference workloads are created equal. The metrics you prioritize should depend on what you're building.
For interactive applications, user perception is everything. The north star metric is TTFT p95 < 500ms, followed closely by ITL p95 < 250ms to ensure streaming feels natural. Write your SLAs against p95 values and monitor p99 for early warning signs. E2E latency matters, but users tolerate longer total response times if the streaming experience is smooth.
Note: Rafay's Token Factory supports inference engines like vLLM and NVIDIA NIM with dynamic batching and NVIDIA Dynamo for distributed optimization — all tuned to keep these latency metrics tight.
Batch and Offline Workloads (Pipelines, Evals, Data Generation)
For batch processing, latency is secondary to efficiency. The north star metrics are Tokens Per Second (TPS) and cost per million tokens. You want to maximize GPU utilization and minimize idle time. Goodput — the throughput that actually meets your SLO requirements — matters more than raw TPS. High TPS with bad latency equals low goodput.
Note: Rafay's auto-scaling and multi-tenancy capabilities allow you to run batch workloads alongside interactive services, sharing GPU resources while maintaining isolation and governance.
6. Reading the Dashboard: A Practical Walkthrough
Let's walk through what a real Rafay Token Factory metrics dashboard tells us, using the example of a Qwen3 Coder model deployed with NVIDIA Dynamo as the inference engine.
At a glance: The summary cards show TTFT at 76ms (p50), ITL at 18ms, E2E at 11.36s, and KV cache at 2.33%. This deployment is performing well — TTFT is well under the 500ms interactive threshold, ITL is very smooth (18ms means roughly 55 tokens per second of streaming speed), and KV cache has plenty of headroom.
Looking deeper: The TTFT time-series chart reveals an interesting pattern — a spike early in the observation window (p99 briefly hitting ~1 second) that quickly resolved. This could indicate a cold start, an auto-scaling event, or a temporary burst of traffic. The subsequent flattening shows the system stabilized.
The ITL chart shows remarkably tight banding between p50 and p95, with the p99 line sitting close to the pack. This is a sign of a well-configured decode pipeline with minimal interference between concurrent requests.
The KV Cache chart shows a dramatic peak early on (around 30%) that settled into a low-utilization pattern. This correlates with the TTFT spike — during the initial burst, many concurrent requests filled the KV cache, causing brief queuing. Once load normalized, cache usage dropped and latencies improved.
7. From Metrics to Action
Metrics are only valuable if they drive decisions. Here's a quick reference for what to do when metrics go sideways:
TTFT is high: Check queue depth and request arrival rate. Consider adding replicas, enabling prefix caching, or reducing input prompt sizes. If TTFT is high only at p99, you may have bursty traffic that needs faster auto-scaling response.
ITL is degrading: Look at KV cache utilization and GPU memory bandwidth. Long output sequences grow the KV cache, increasing per-token attention cost. Consider reducing max output length or upgrading to GPUs with higher memory bandwidth (e.g., H100 over A100).
E2E latency exceeds SLO: Decompose into TTFT + (ITL × tokens). Identify which component is contributing most and address accordingly.
KV Cache near capacity: Add replicas, reduce max sequence length, enable more aggressive cache eviction policies, or consider quantization (INT8/FP8) to reduce per-token cache size.
Conclusion
Running LLM inference in production isn't just about deploying a model — it's about continuously understanding and optimizing how that model performs under real-world conditions. Rafay's Token Factory provides the metrics infrastructure to do exactly this, giving operators visibility into the latency, throughput, and resource utilization characteristics that determine whether an inference service is truly production-grade.
The key takeaways:
TTFT, ITL, and E2E latency are your three latency lenses — each reveals different aspects of performance.
Percentiles matter more than averages — always look at p95 and p99, not just medians.
KV cache is your hidden bottleneck — monitor it as closely as latency.
Optimize for your workload type — interactive and batch workloads have fundamentally different north star metrics.
Use the Rafay dashboard's time-series charts to correlate events, spot trends, and catch problems before your users do.
With Rafay's Token Factory surfacing these metrics out of the box — alongside the platform's built-in auto-scaling, multi-tenancy, and token-metered billing — operators have everything they need to run inference services that don't just work, but work well.
Compute Is the New Revenue: What I Heard at the AI Infra Summit
At the AI Infrastructure Summit, leaders from NVIDIA and Rafay discussed the financial shift in AI buildouts. Explore the four tiers of AI infrastructure monetization and discover why scaling up the value chain efficiently is critical for operators.
52.6% More Tokens, 1.53× Less GPU Time: Production Inference with Minima and Rafay
A single NVIDIA Blackwell GPU, an optimized Qwen3.6-27B worker from Minima, and Rafay Token Factory around it. The result was a governed, multi-tenant, token-metered service that delivered 52.6% more output than a strong FP8 baseline, with usage records reconciled at 99.97% for billing